April 2020 was Earth’s second hottest April on record. The average temperature globally was 1.91°F warmer than the 20th-century average, serving as a powerful reminder that climate change is an ongoing threat worldwide.
Though the global warming trend is clear, it is sometimes difficult to comprehend how our day-to-day weather experience fits into the larger climate change picture. During several cool morning walks in Gainesville, Florida this spring, I found myself wondering — is it normal to have morning temperatures in the 40s (°F) in April?
Fortunately, the National Oceanic and Atmospheric Administration (NOAA) provides tools and data that can help us better visualize climate change as it’s happening in our own backyard.
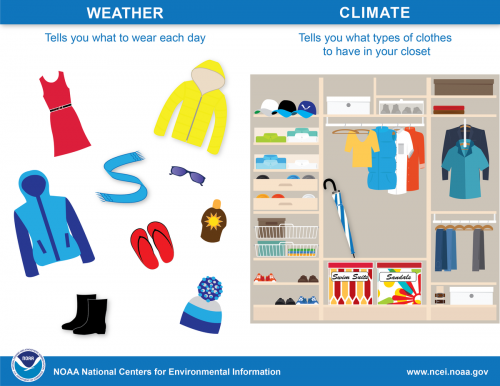
First, it’s helpful to review the differences between climate and weather. Put simply, weather refers to daily, ongoing changes in our atmosphere in a particular location — which we measure through temperature, humidity, air pressure, and more. Climate refers to trends in what the weather is like in a particular location, over a long period of time. It can be measured in terms of average temperature, average humidity, and more.
So, how did this year’s spring weather in Florida stack-up against the historic climate conditions?
Perhaps unsurprisingly, spring 2020 in Florida was one for the record books. NOAA’s Climate Monitoring dashboard shows February-April 2020 to be the warmest on record. The average temperature for the three-month period was 69.3°F, which is 5°F warmer than the 20th-century average.
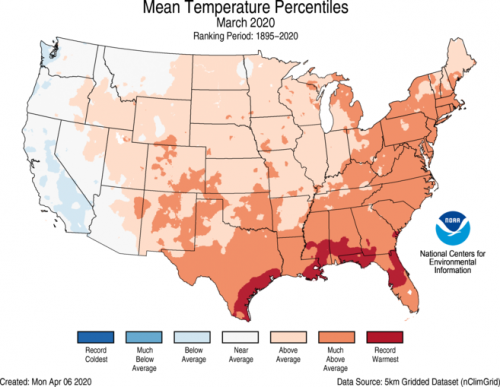
March 2020, in particular, saw record-breaking heat across much of Florida. The average temperature for Florida in March measured 7.0°F above the 20th-century average.
In terms of precipitation, the springtime period of February-April 2020 was only slightly drier than the 20th-century average, with total precipitation being only 1.71″ under the mean.
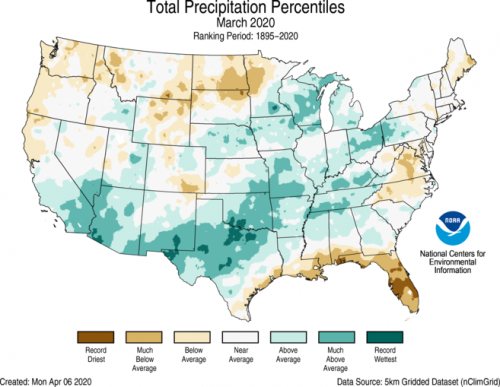
March 2020, however, was once again a stand-out month. Florida experienced its second-driest March on record, accumulating only 0.54″ of precipitation — 3.15″ less than the 20th-century average. Central Florida in particular experienced record-dry conditions for March.
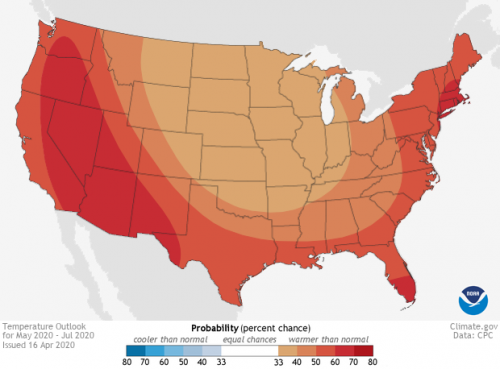
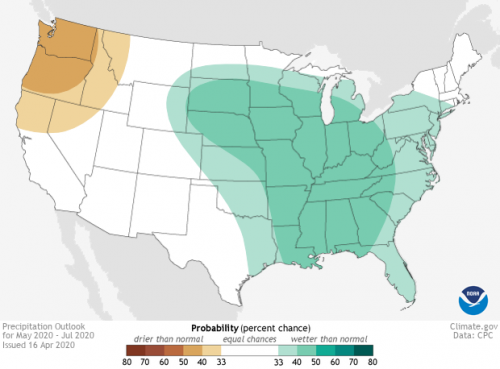
With record heat and dryness already on the books this year, what can we expect from this summer in Florida? Fortunately, NOAA has tools for that too! The Data Snapshots tool shows both a three-month temperature and precipitation outlook for the continental United States.
In terms of temperature, it’s predicted that May-July 2020 will likely be warmer than normal for all of Florida, with South Florida seeing the greatest chance of experiencing above-normal temperatures.
Moving away from the dryness of spring, Florida’s summer is somewhat likely to be wetter than usual, with the Panhandle seeing the highest chances of additional rain.
These outlooks are by no means a guarantee, so it will be interesting to see how the summer unfolds. Will there be more records shattered this year? We’ll check back in at the end of the summer to find out.
In the meantime you can keep tabs on Florida’s climate yourself using the following tools:
NOAA National Centers for Environmental Information, Climate Monitoring dashboard: https://www.ncdc.noaa.gov/climate-monitoring/
NOAA News: https://www.noaa.gov/news/all
NOAA Climate.gov, Data Snapshots: https://www.climate.gov/maps-data/data-snapshots
NOAA National Centers for Environmental information, Climate at a Glance, Statewide Time Series: https://www.ncdc.noaa.gov/cag/.