Distinguishing exact stratigraphic relationships between the sedimentary units that outcrop in the Canal remains a question of debate. Here, we will look at a series of figures used by geologists to interpret observations of rocks in the field.

(1) MAP VIEW

The first step is to create a map. What different types of rocks outcrop on the surface and where? Geologic maps are created by mapping the bedrock as it changes.

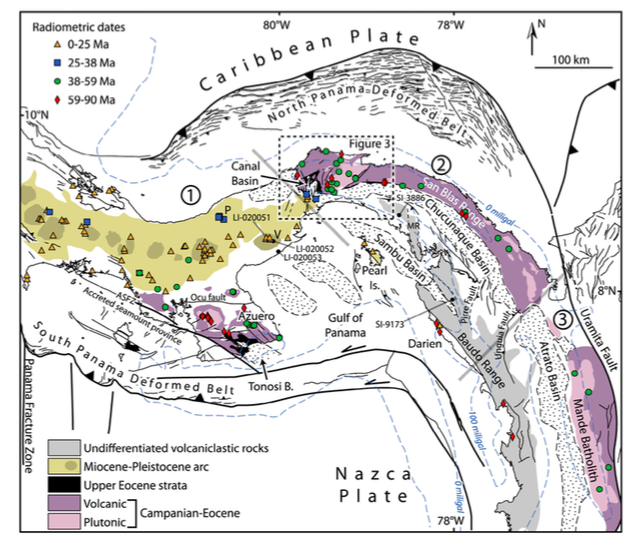
Below, a bedrock geologic map of the Canal region.  The majority of rock types that outcrop in the area of the canal are early-Miocene (~20 million years old).

Bedrock geologic map of the formations that outcrop along the Panama Canal. Different colored and fill textures distinguish different rock types. Note the abundance of volcanic rocks, as much of Panama was formed from a marine volcanic arc. Sedimentary sequences in which fossil excavation occurs formed in basins between volcanic islands, and thus exhibit a mix of shallow marine/brackish to deep water fossil fauna.

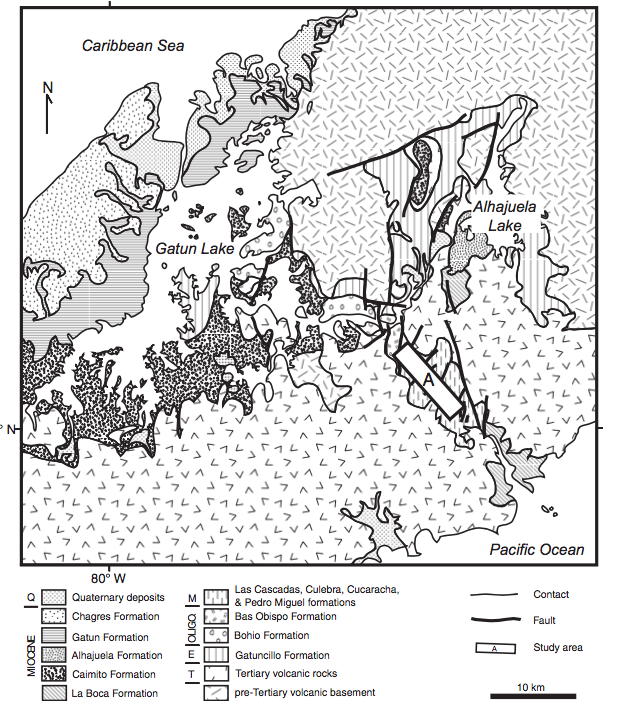
The Miocene-aged Panama Canal rocks (the Las Cascadas, Culebra, Cucaracha and Pedro Miguel Formations- labeled ‘M’ in the bedrock map legend), are primarily sedimentary rocks (sandstones, siltstones and mudstones). This sedimentary detritus accumulated in basins between eroding volcanic islands, landmasses which eventually accumulated into a continuous isthmus connecting North and South America.

(2) CROSS SECTION

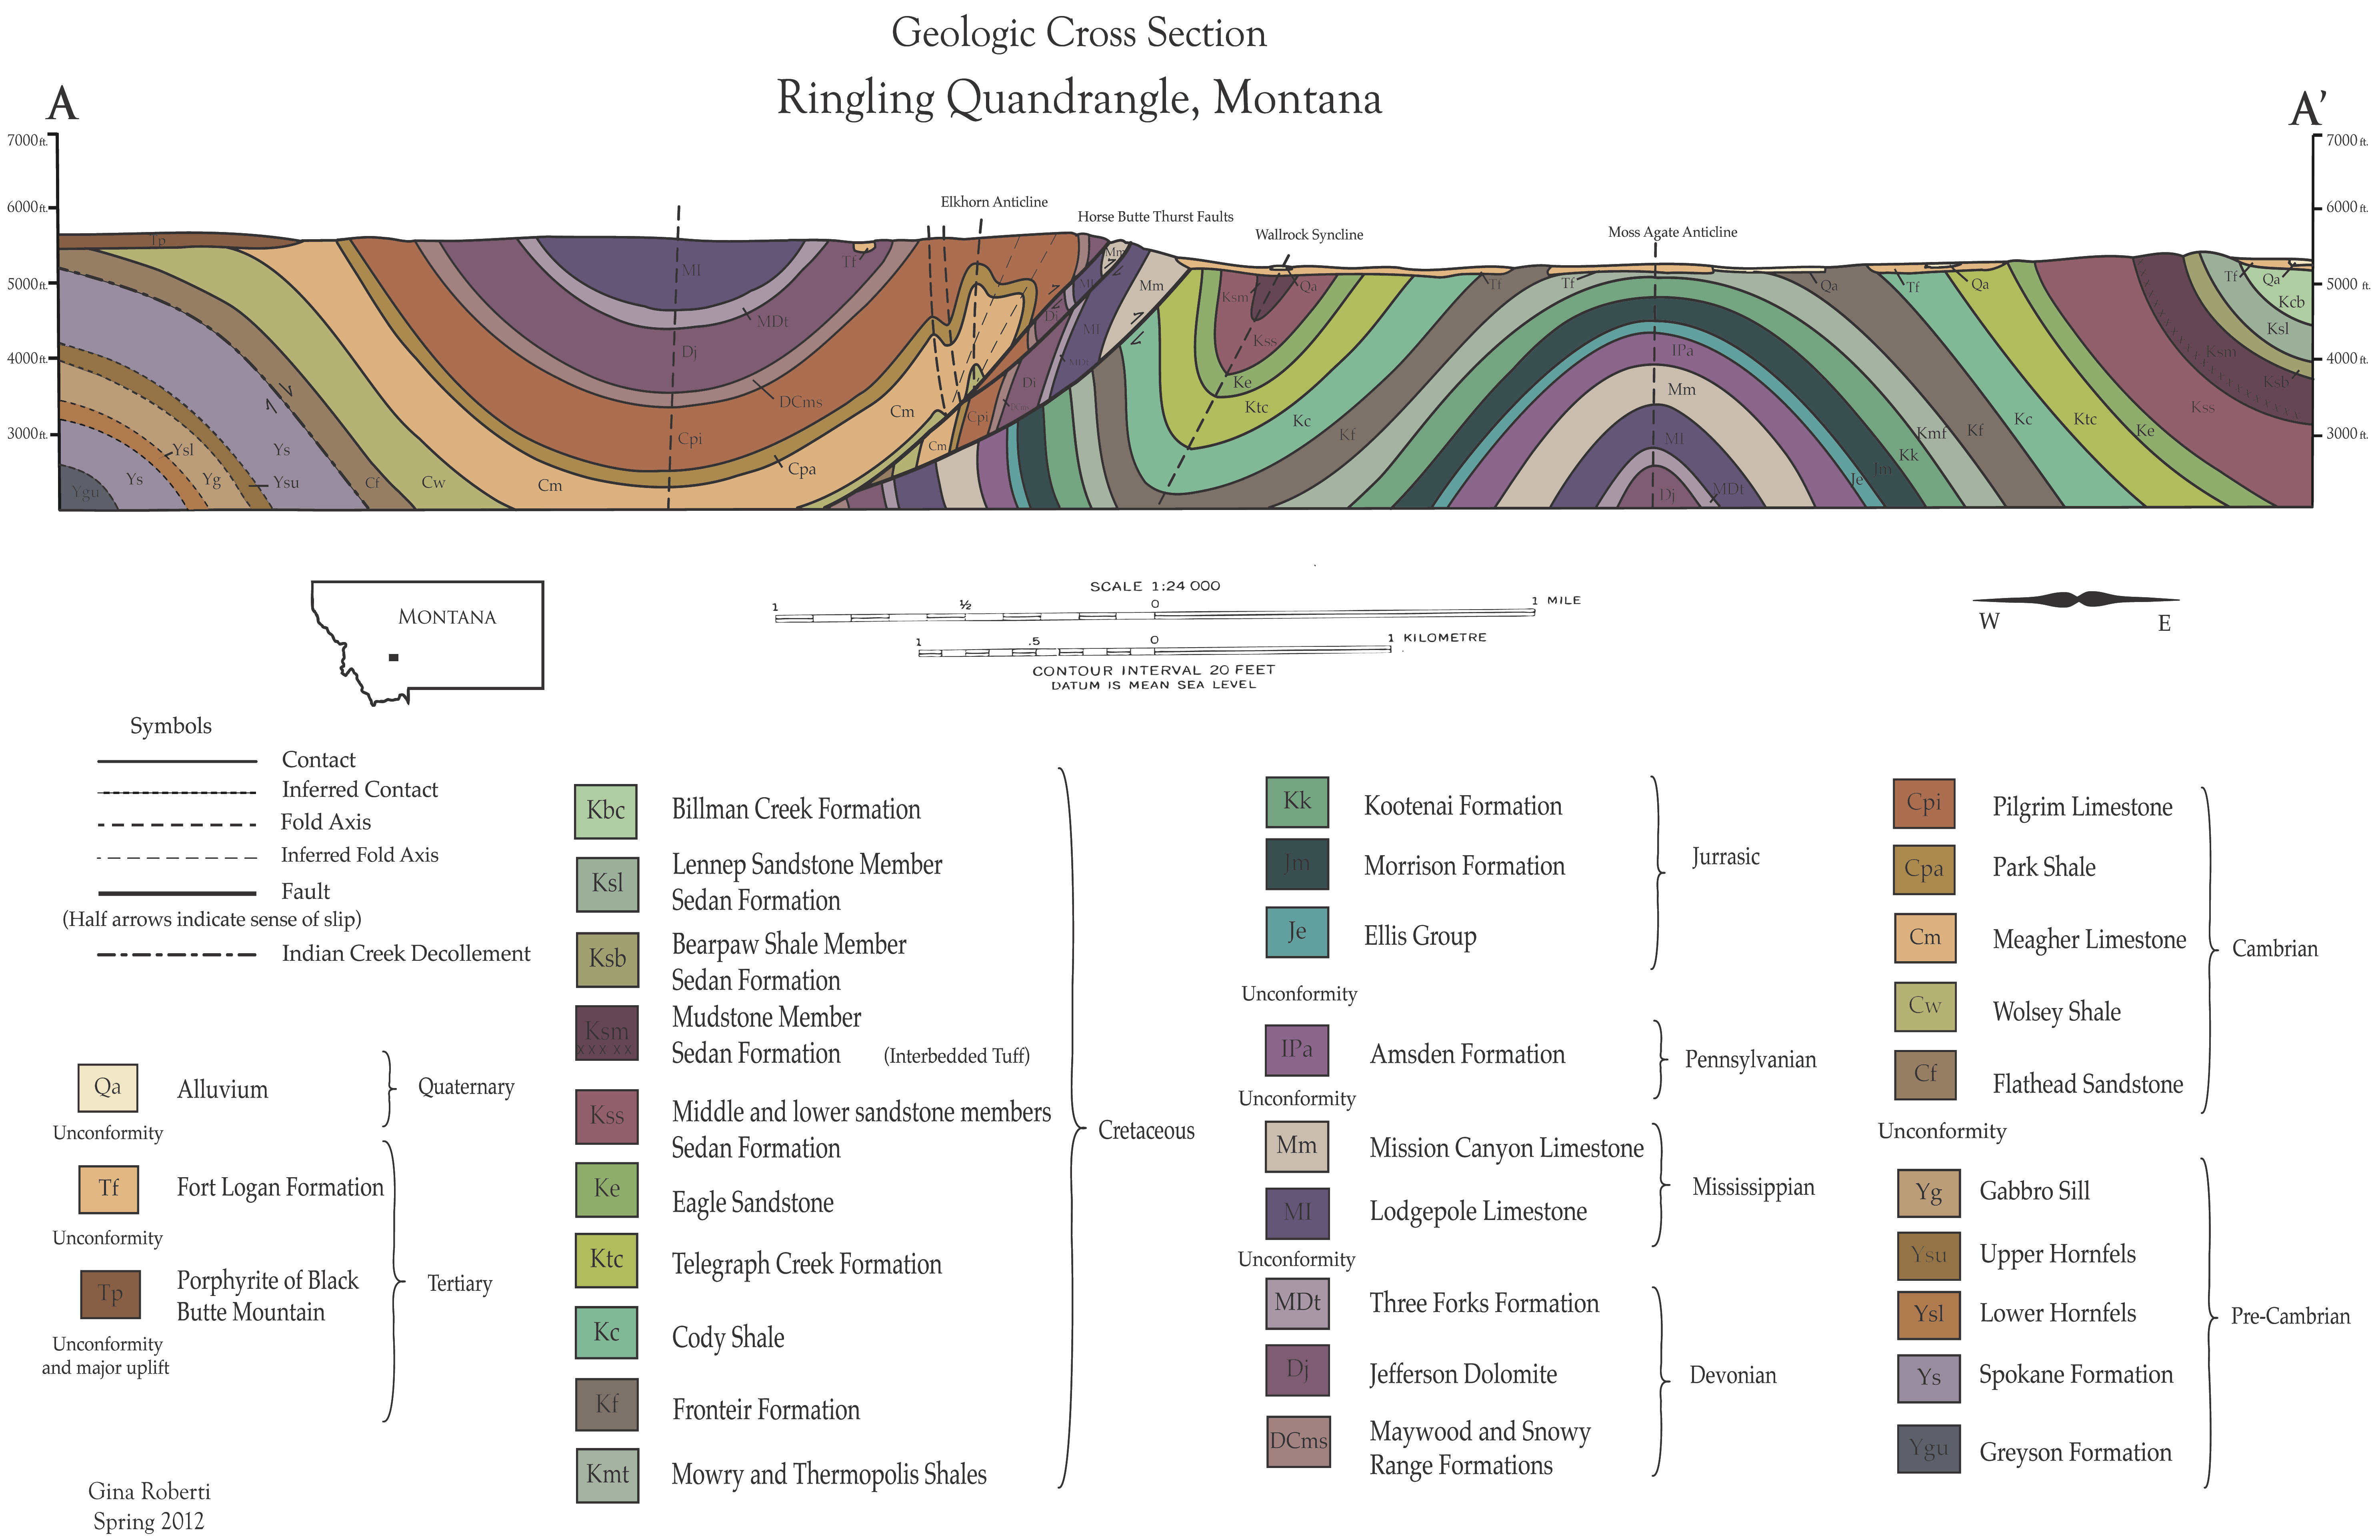
By noting structural relationships between different rock types, we can infer the three dimensional relationships of those rocks stacking underground. In this way we progress from a map in bird’s eye view to cross section. A cross section view often exhibits a vastly more complex picture than initially apparent on the surface. See the reference below.

Sample geologic cross section, 'step 2' in analyzing the bedrock geology. Different colors represent different rock units. This cross section was inferred using the bird's eye geologic bedrock map and information about the tilt (in structural geology called the dip) of various rock units. Project by Gina Roberti, Brown University 2013.
Sample geologic cross section, ‘step 2’ in analyzing the bedrock geology. Different colors represent different rock units. This cross section was inferred using the bird’s eye geologic bedrock map and information about the tilt (in structural geology called the dip) of various rock units. Project by Gina Roberti, Brown University 2013.

(3) STRATIGRAPHIC COLUMN

By analyzing structural relationships, geologists can move from a two-dimensional map to visualizing 3-D relationships between different rock units in cross section. Each rock unit, or geologic formation (in the column to the left), is mapped in detail. All textures and symbols have a specific meaning; even the contacts between units are denoted whether observed (and type) or inferred.

The figure below is a sample stratigraphic column for the primary formations which outcrop in the Gaillard Cut of the Panama Canal. Interpretations of the paleoenvironment are listed on the right.

Sample stratigraphic cross section of rock units of the Gaillard Cut of the Panama Canal. Oldest rocks are on the bottom, with younger sequences forming on top. The environment of deposition is inferred from observations about the rocks (grain size, shape, etc.) and fossil fauna; interpretations are made in the column to the right. LCF = Las Cascadas Formation, P.MF. = Pedro Miguel Formation. Source: Kirby et al. 2008.

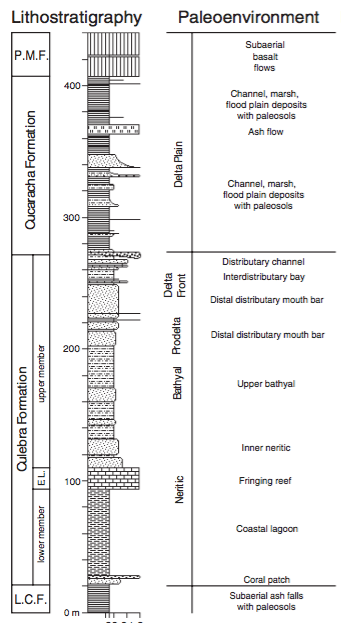
How do we determine the paleoenvironment? Interpretations based on observations.

The following illustration is a detailed and scientific reconstruction of the hypothesized paleoenvironment during the early Miocene. Centenario Fauna, ~19 million years ago. On display at the BIOMuseo, Panama City. Illustration by D. Byerley © Florida Museum of Natural History.

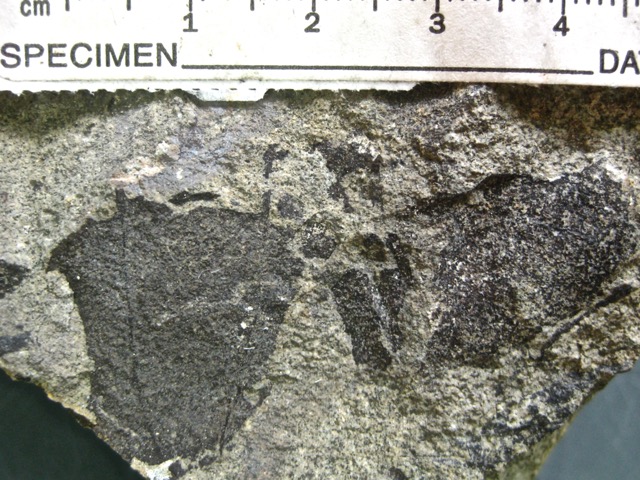
Fossils uncovered in the Miocene-age Canal formations give clues to the environment in which these fossils accumulated (to a geologist, the ‘depositional environment’). The mix of fossil types, ranging from clams to plants, mammals and crocodilian teeth, all record changes in the environment over time. (Eg., Terrestrial vs. marine.) The sands, muds or silts in which those fossils are preserved reflect the depositional setting in which those fossils were preserved. (Fast moving river vs. quiet lagoon.) Geochemical parameters give information about the chemical conditions. (Carbon isotopes, paleotemperature, etc.).

A fragment of a fossilized crocodilian tooth, a common find in the PCP Canal Localities.

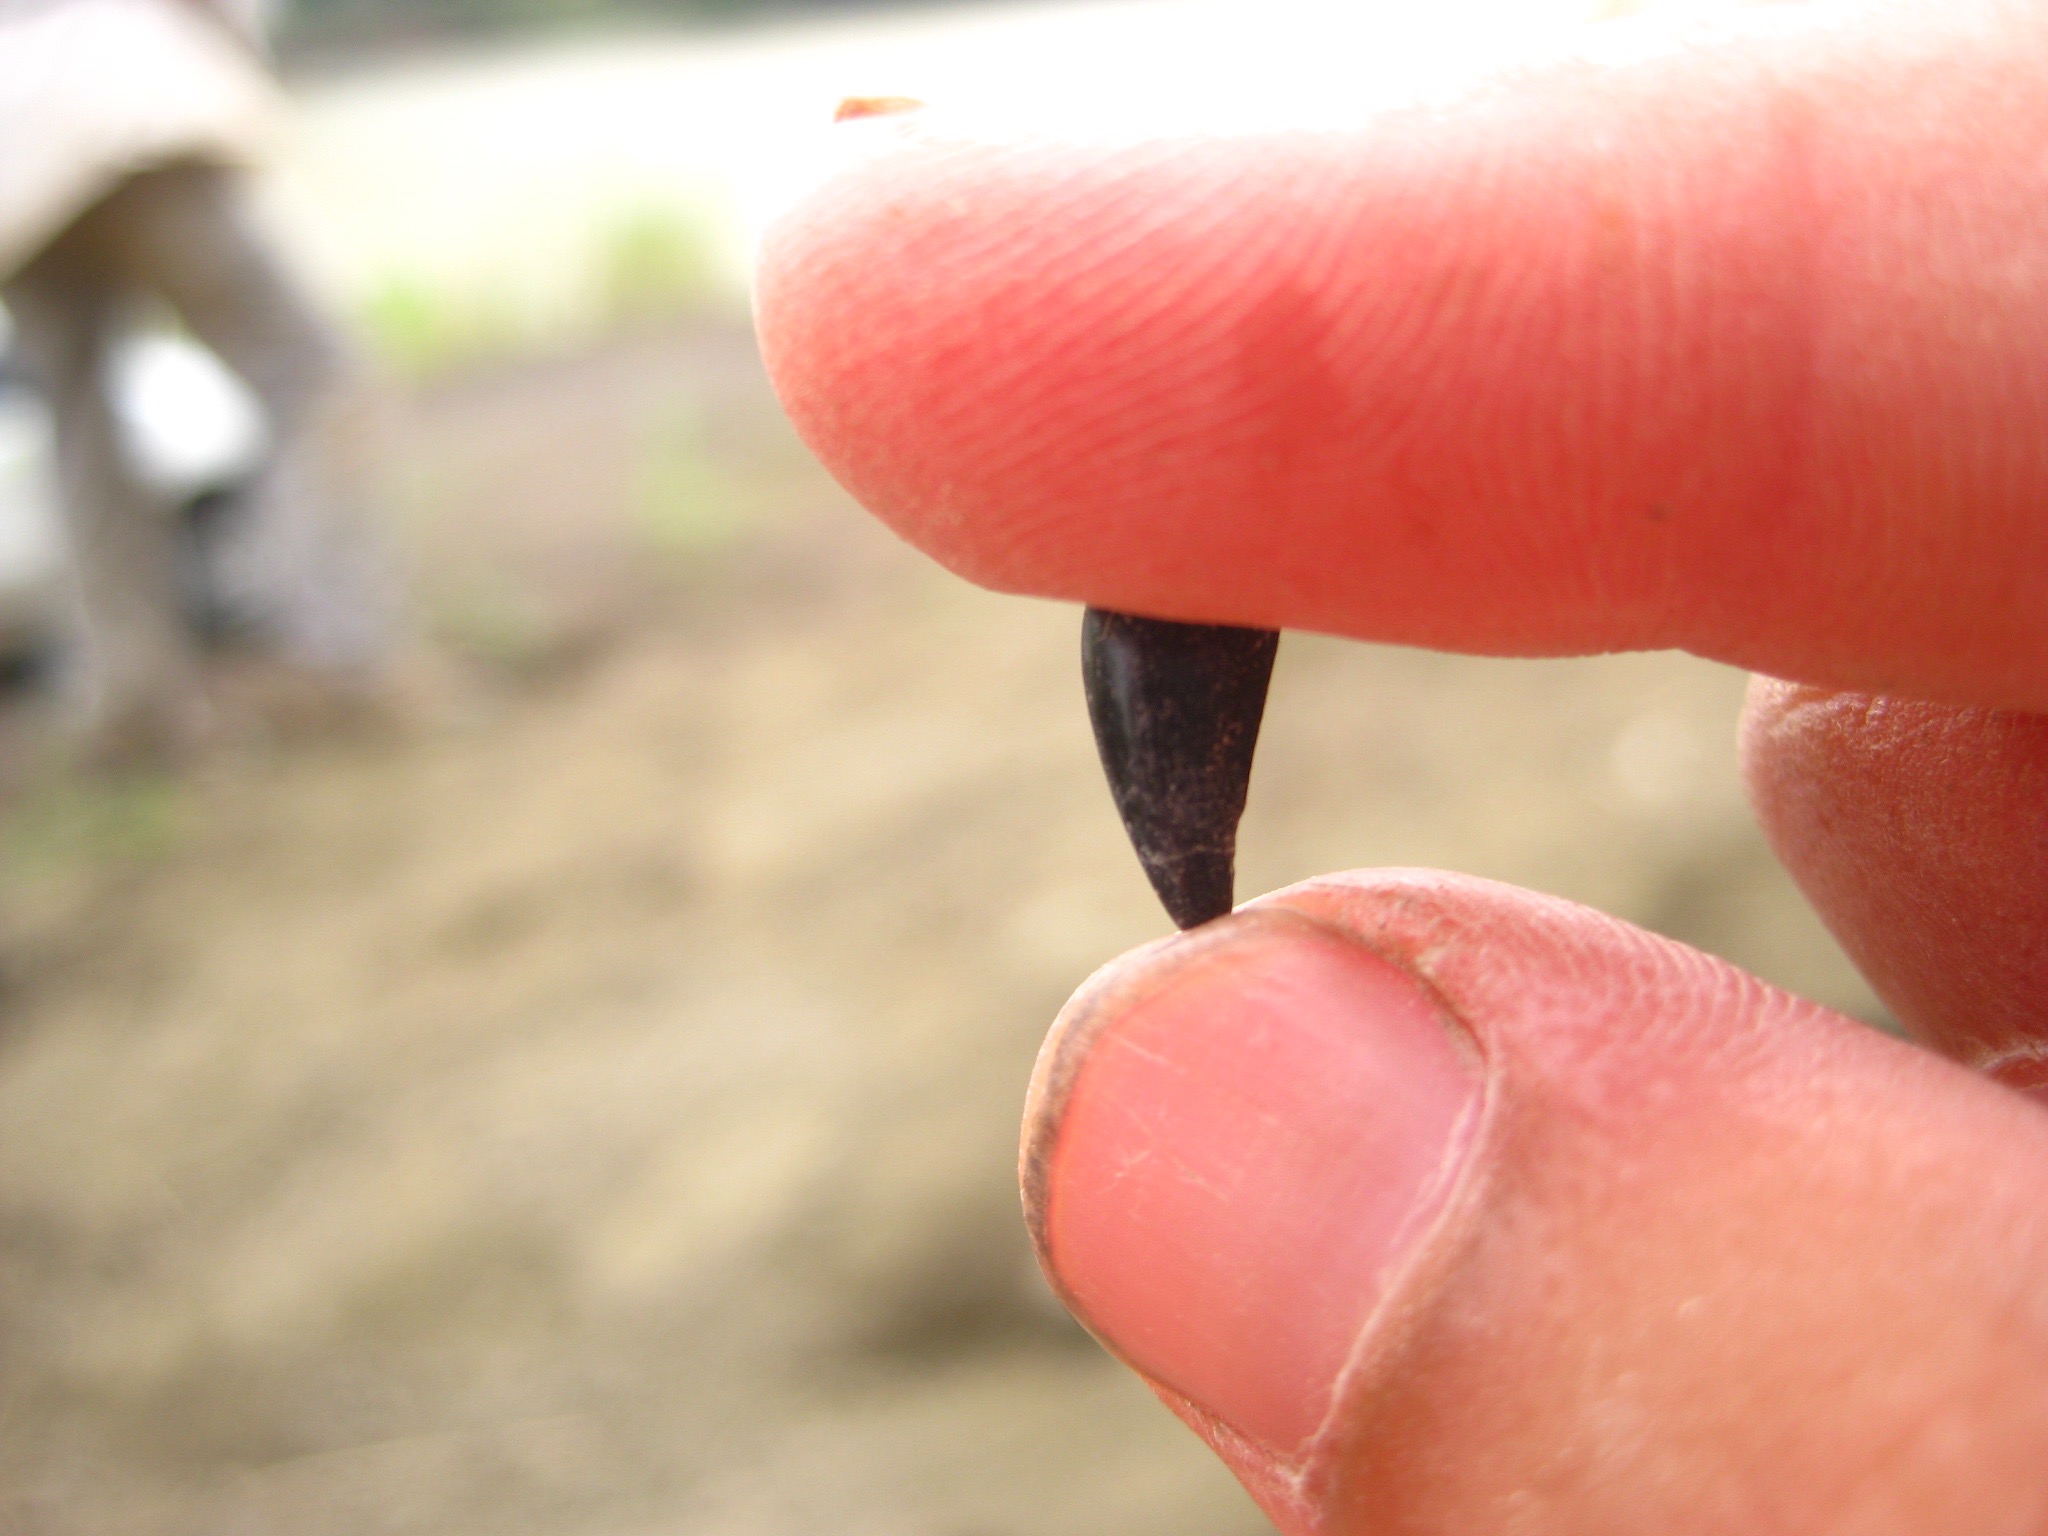
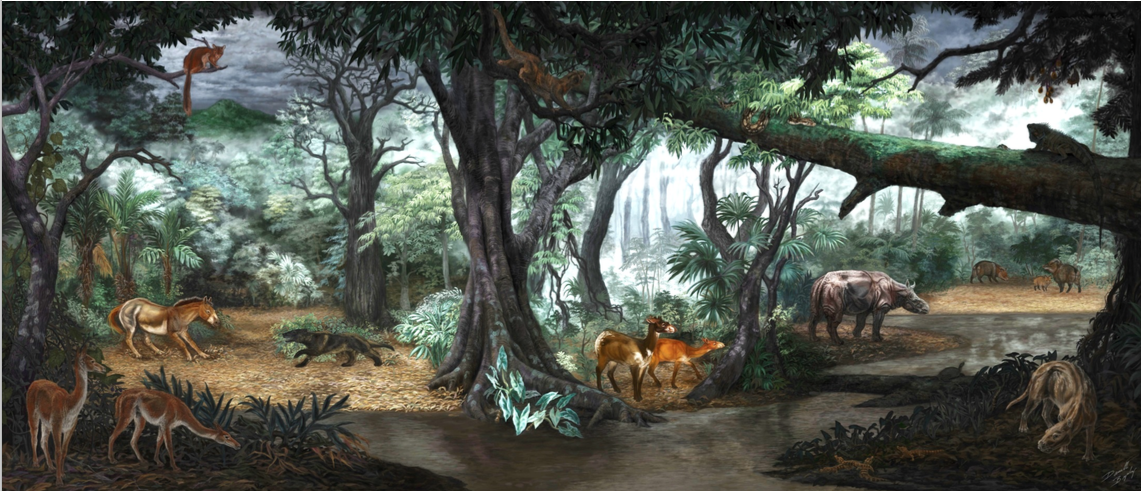
For example, the abundance of crabs, leaves and other marine invertebrates in the Culebra formation give evidence to multiple stages of marine transgression and regression, in which sea levels rose and fell. Clams and gastropods indicate saltwater environments. Fossils in the Cucaracha Formation, by comparison, include teeth of ancestral horses, camels, and other terrestrial species. Yet, these pieces have been rounded and broken by the flow of water, and are found along with many pebbles of similar size (1-3cm in diameter) and degree of rounding. This suggests the fossil pieces were transported and sorted by some mechanism, most likely by a river, accumulating as part of the rock.

(4) TECTONIC INTERPRETATION

Fossilized leaves are preserved within a relatively coarse grained sandstone of the Culebra Formation. Leaf margins, stomatal density and patterns in veination can all be used to determine not only the species or genera, but also the type of environment in which the plant was living.

If the stratigraphic column can provide an interpretation of the paleoenvironment, we return to the geologic map for the most complex interpretation: the tectonic history.

The stratigraphic column reveals the majority of rock types in the area of the canal are (1) volcanic and (2) sedimentary. Yet, volcanic tuffs and sedimentary rocks form in very different environments. Here then comes the geologic interpretation. The abundance of volcanic rocks suggest volcanism was common in Panama during the Miocene (~20 million years ago), around the same time that basins between the volcanos were filling with sediments. Hence, we see a mix of sedimentary rocks (sandstones, siltstones, mudstones) interspersed with volcanics (tuffs, basalts, volcanic conglomerates).

Below, a geologic map shows one way to interpret this setting. Volcanic ‘regimes’ of different ages are highlighted in different colors (yellow versus purple). Sedimentary sequences in which fossils accumulate are believe to have formed in basins between volcanic islands, and thus exhibit a mix of shallow marine/brackish to deep water fossil fauna.

Geologic interpretive map of Panama. Volcanic arcs (islands built from volcanic material, similar to Japan today) are colored in yellow and purple (distinguished by age). Sedimentary basins, including the basins in which sedimentary rocks of the Panama Canal formations formed, are hashed and dotted areas. It is believed that the sedimentary rocks accumulated in basins besides and between the volcanic arcs. The Panama Canal Basin is believed to be attached as a peninsula extending from North America. Source: Montes et al. 2012.

And so, What is the role of a paleontologist? Thorough, steady, meticulous observation, documentation, interpretation.

PCP-PIRE Intern Paris Morgan observes the passage of a large ship through the Gaillard Cut, August 2015.

Fossils are just one piece of the puzzle, as only as important as the context in which they are found. It is the combination of fossil evidence pLUS analysis of the bedrock geology which is necessary for a full interpretation of the rock sequence. Happy hunting!

Photography and text original, Gina Roberti. Summer 2015.