This past week was a busy one in the field, due to all those who joined us during University of Florida’s spring break. So many exciting fossil finds! Lots of long, hot, sticky days too, of course. We’re still going out into the field each day, but perhaps now’s the time to take a quick mental break from the heat and write about something we did a few weeks ago, in an air-conditioned room at STRI’s Tupper facility with coffee and pastries provided. We attended a three-day course on GIS and mapping with R given by Richard Condit, a STRI staff scientist.
 R is a programming language used for statistics and graphics that has been gaining popularity within the scientific community recently because it’s open source, there are ample online forums discussing how to do anything under the sun with R, and it’s very transparent, which is important for ensuring that experiments are repeatable.
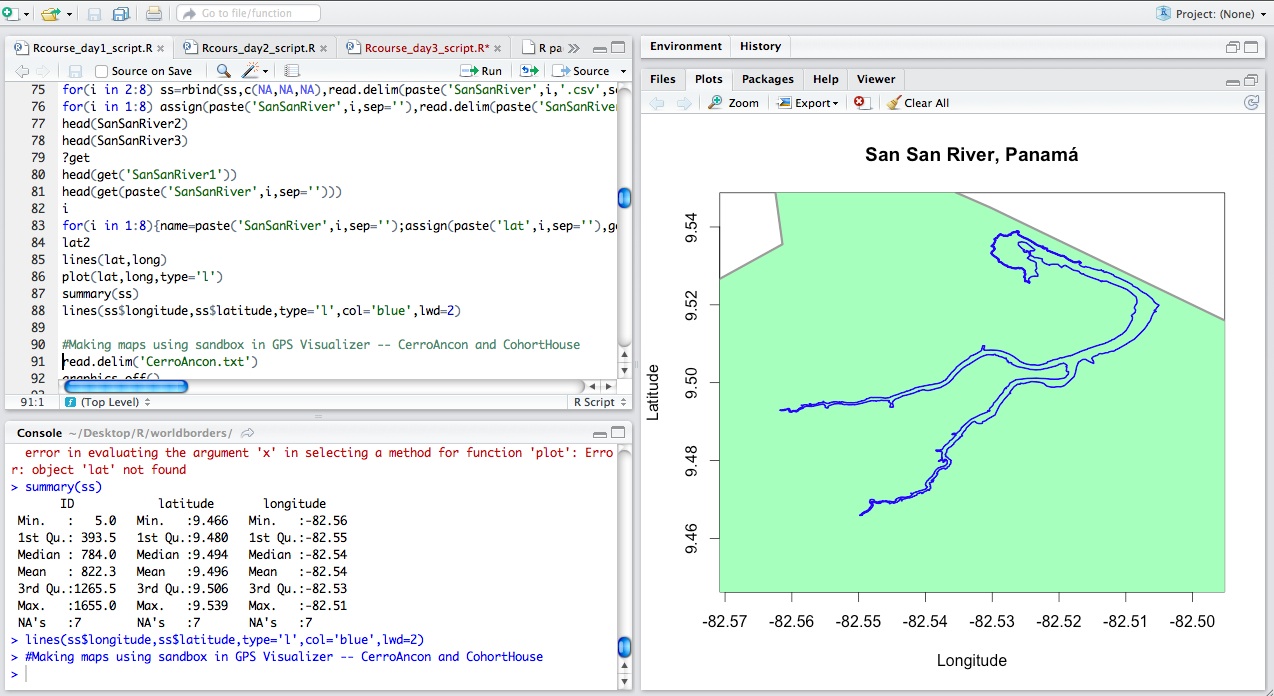
We prepared for the course a little bit beforehand as it was the first foray into R for all of us, but it was startling how quickly we were able to advance under Dr. Condit’s guidance. Within the first day we were using GIS data to create visual maps of Panama and the world. By day three, we had created our own features (I made a polygon representing Cerro Ancon, where we live), learned to add attributes to features, and were working with rasters. It isn’t hard to imagine situations where knowing how to work with spatial data in R would come in handy; some of our classmates were already applying what they had learned to their own research. Hopefully we will have the chance to learn more about R, perhaps by mapping some of our localities.
Go Gators!