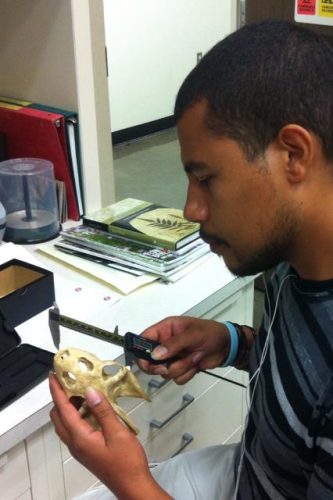
In order to tell whether the turtle skull I am studying is different than the skulls of modern relatives, I needed to run a morphometric analysis. This means I needed to take measurements of many different features on many different specimens and then analyze the relationships among those measurements. There are a few ways to do this. Traditionally, measurements of lengths, angles, masses, etc are taken and compared between a set of specimens. These measurements are essential and are the first step in studying variation in a species. We can use this data to understand development, as in a growth series, or population differentiation across space. The main challenge for interpreting these relationships is that most of these measurements are correlated, for example, forearm length will vary with the length of the humerus. In order to make these comparisons informative, we have to remove the effects of size. We do this by standardizing the data.
As one may imagine, it is difficult to make comparisons as the data sets get larger and larger in terms of number of specimens and number of measurements. There are programs that can be used to help visually represent this variation. R is a statistical analysis program that allows you to write computer code to take the data and manipulate it in all kinds of ways. The manipulated data can be visually represented by any number of graphs and charts. As in all code writing, there is a lot of going back and forth, fixing code errors that can be as small as a misplaced comma. I started by looking at box plots of my measurements to see where the greatest variation was and then looked over bivariate plots to see which pairs of measurements have most interesting or unexpected relationships.
I am still working my way through a great R tutorial created by DataCamp (www.datacamp.com) and hosted by the swirl project (www.swirlstats.com). It’s not easy but it’s not unlike learning how to use a suped-up scientific calculator. I still have a lot to learn but I can see the power of adding a program like R to my Paleo toolkit.