Taphonomy is the study of how an organism becomes preserved as a fossil. The word originates from the Greek word taphos, which means “burial”. There are many ways that an organism can become a fossil, and often more than one step is involved in this process. Usually, there are stages of physical and chemical changes to the hard parts of the organism to make it a fossil.
Useful information can be acquired from studying taphonomy, including information about how old the fossil is, and the depositional and preservational environment that the fossil was exposed. In shells like the ones we get from the Po Plain sediment cores, there are often varying degrees of fossilization, which can be scored using a taphonomic scoring system.
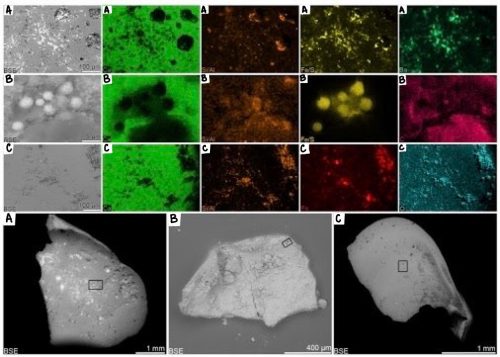
This is an image of three Po Plain shells with varying taphonomic scores showing elemental maps of certain areas of the shell. We are interested in the micro-scale degradation of the shells across different depositional environments and system tracts.
Shell A (left) is from a delta front/strandplain depositional environment during the Holocene highstand system tract (regression). This shell contains heavy pitting with the mineral, pyrite occurring preferentially in the pits. The shell has the presence of the mineral, barite, which occurs primarily in marine waters with organic matter. Barite also can occur diagenetically within sulfate reducing sediment in anoxic/oxic boundaries.
Shell B (middle) is from an inner lagoon environment during the Holocene highstand system tract, found in silty clay and peat dominated sediments. This shell has pyrite framboids forming across the shell with the presence of organic carbon.
Shell C (right) is from an outer lagoon/bay environment during the Holocene transgressive system tract, specifically from a wave ravinement surface. This shell has the presence of aluminosilicates with some iron.
These characteristics are not seen under a regular light microscope. To see these features we used an Environmental Scanning Electron Microscope (ESEM), and in order to get relative elemental abundances we had to use Energy Dispersive X-ray Spectroscopy (EDS).
