How do you monitor the number and location of Earth’s plants and animals at any given time? It’s a daunting, planet-sized problem, but an international team of researchers has published a proposal for how to do just that.
As wildlife faces threats from habitat loss, invasive species, disease and climate change, policymakers need clear, accurate information to make sound conservation decisions. But gathering massive amounts of biodiversity data globally and turning this information into white papers and data visualizations that help decision-makers make informed choices have remained persistent challenges.
But biologists and big data experts are getting closer to solutions, looking to the climate community as a model for how to amass and translate global data sets for scientists and policymakers. Today, a team published an outline for measuring and tracking plant and animal populations in space and time, one of the key components for assessing the health of the planet’s biosphere.
“There are so many gaps in our knowledge of biodiversity where we don’t have the capacity to properly make decisions because of data limitations,” said study co-author Robert Guralnick, associate curator of biodiversity informatics at the Florida Museum of Natural History. “This paper really throws the gauntlet down in terms of what we can do – not in 10 or 20 years, but what we can begin to do today to deliver data at a national and international level to decision-makers who can help stem the loss of wildlife.”
Just as a person may monitor her heart rate via a Fitbit or check her blood pressure at the pharmacy, scientists are working to define the “vitals” of plants and animals, the core aspects to measure and assess a species’ or ecosystem’s health. “Species populations” is one of six “vitals” or “essential biodiversity variables” identified by the Group on Earth Observations Biodiversity Observation Network, or GEO BON, an international collaboration to sync wildlife observation programs at the global level.
“Humans are complex beings with lots of parts and processes. You can’t just measure your blood pressure and say you’re healthy,” Guralnick said. “That’s also how the planet works. We need to measure lots of things. This will help us generate health stats for the planet that encompass the complexity of its systems.”
Guralnick, co-chair of GEO BON’s data task force, described the team’s model for measuring species populations as a “hypercube,” a 3D means of recording the presence of a species at a given point in time and space.
“The cube helps us keep everything centralized in a common framework,” he said. “You can ‘roll’ the cube to look at spatial patterns of where plants and animals are found or ‘roll’ it to reveal species’ change through time. You need all of that information in one framework to be able to generate the kind of full-scale data resources we need for decision-making.”
By tracking essential biodiversity variables such as species populations, GEO BON can assess progress toward national and international policy goals, including the United Nations’ Sustainable Development Goals for 2030 and the Convention on Biological Diversity’s 2020 Targets.
“Our goal is to be able to use these data to produce a kind of report card on biodiversity that policymakers can use to discern how we’re doing and whether we’re meeting targets for conserving wildlife and sustaining human health and well-being,” Guralnick said.
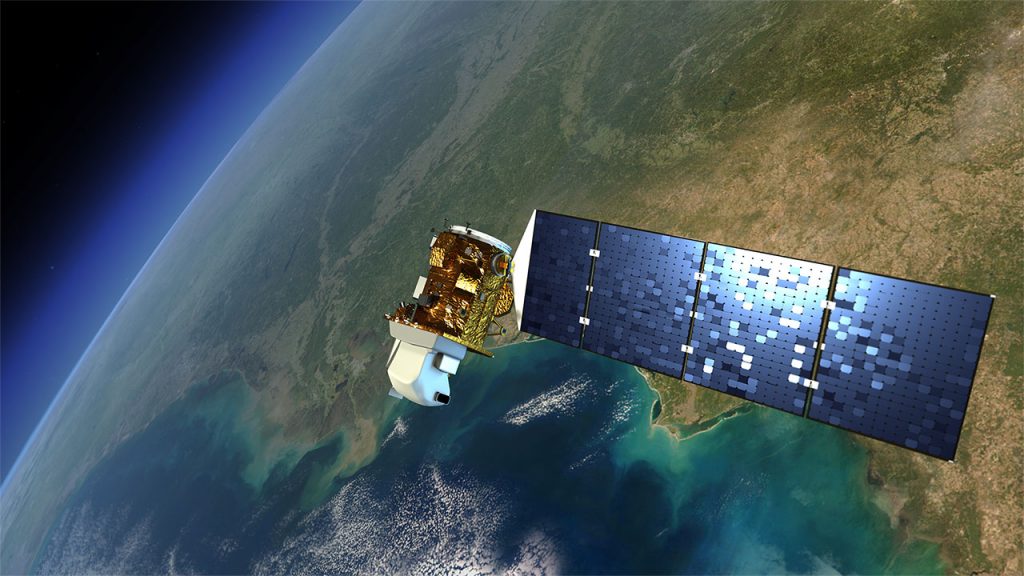
One challenge, however, is that not all data are created equally. A single observation of a backyard cardinal in Dallas in 1978 is a lower-resolution data point than songbird migratory patterns captured via NASA remote-sensing satellites. But all data have value, Guralnick said.
“We have to make sure data are scientifically credible without forgetting that there are some uncertainties built-in,” he said. “But the more people get used to things like spaghetti maps of the projected paths of hurricanes, the more we can use that same visual logic to show uncertainties in trajectories of biodiversity change in a way that will be useful.”
Museums often house the only available records for many species, Guralnick said, which is why large-scale collection digitization efforts such as iDigBio, a National Science Foundation-funded project based at the University of Florida, are crucial.
“Museums have a critical role to play in helping us understand and map the distribution of organisms,” he said. “Museum records contain a species name, place and time, but they have all this other information that makes them important and useful – genes, genomes, physical characteristics and so forth. Every piece of information we bring to the table needs to be used properly. That’s what this paper is about.”
The team published their proposal in Nature Ecology and Evolution. The study was led by Walter Jetz of Yale University, with Melodie McGeoch of Monash University in Australia as the second author.
The research was supported by GEO BON and the German Centre for Integrative Biodiversity Research, or iDiv. Additional funding was provided by NSF and NASA.
Source: Robert Guralnick, rguralnick@flmnh.ufl.edu, 352-273-1980
Learn more about the Guralnick Lab at the Florida Museum
