This September, world leaders gathered at the United Nations Climate Action Summit to discuss concrete strategies to reduce greenhouse gas emissions by 45% in the next 10 years and completely eliminate them by 2050. The hope is to limit the global temperature increase to only 1.5 degrees Celsius. This would reduce the severity of the predicted impacts of climate change like sea level rise, extreme weather, food shortages, and more.
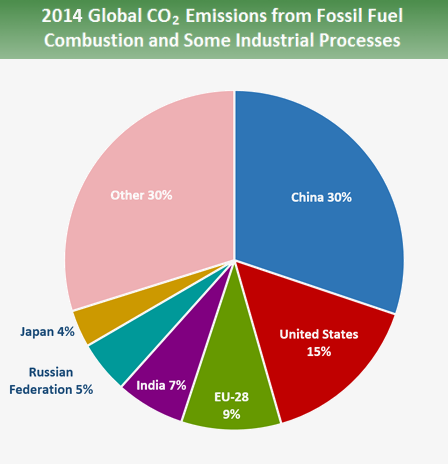
The United States is responsible for 15% of global carbon dioxide emissions, the second highest contributor behind China. This month, I decided to learn more about the sources of these emissions in the United States, as well as more locally here in Florida.
As I began my research on U.S. emissions, I discovered the U.S. Environmental Protection Agency’s Power Profiler tool. Importantly, this website only examines greenhouse gas emissions related to electricity production. It does not capture other key sources of emissions like agriculture and transportation. However, as electricity production accounts for 28% of U.S. greenhouse gas emissions, I figured it was worth learning more about electricity production in Florida and the nation as a whole.
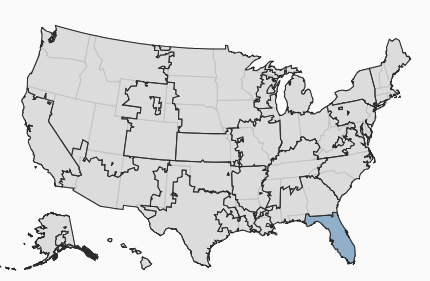
The Power Profiler tool allows you to explore electricity emissions at a national scale, but also by subregion. Many of these subregions include more than one state because electricity is regularly delivered across state lines. There are two subregions that include Florida. The first is SRSO, which incorporates a portion of the panhandle, lower Alabama, a corner of Mississippi, and all of Georgia. The second is FRCC, which encompasses all of Florida east of the Apalachicola River. Since it includes most of Florida, I’ll be looking at the FRCC region as a representation of Florida in this article.
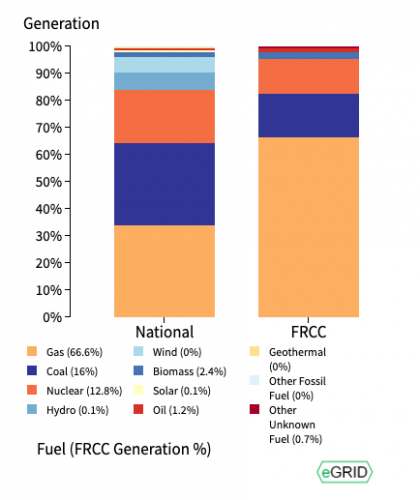
First I explored the fuel sources that Florida uses to generate electricity compared to the nation overall. At 66.6%, the largest percentage of Florida’s electricity is fueled by natural gas. This is nearly double the national average, in which only 33.8% of electricity is fueled by natural gas.
This high percentage of natural gas is good for Florida’s emissions footprint, as that fuel produces much less carbon dioxide when burned than both coal and oil. However, Florida lags behind the national average when it comes to low-to-no emissions fuel sources like nuclear, wind, hydro, solar, and biomass. I calculated that only 15.4% of Florida’s power comes from these low-emissions sources, compared to 33.5% nationwide.
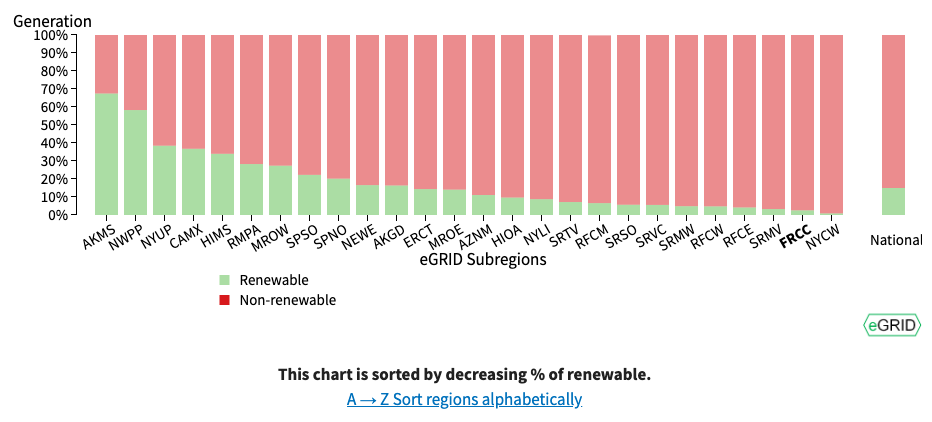
Florida also lags behind the nation in its proportion of renewable energy. Only 2.6% of Florida’s power is fueled by renewable sources like solar, wind, water, and biomass. Nationally, the average is 15%. I was shocked that in the Sunshine State, only 0.1% of Florida’s electricity is from solar power!
I want to note that while this discussion is focused on emissions only, there are many factors to consider when discussing the environmental impact of a particular electricity fuel source. These include extraction impacts, land footprint, water use, and waste disposal. You can explore some of these impacts here.
The Power Profiler also allows you to estimate the emissions produced from your personal electricity use and see how they compare to national averages. I logged-in to my account with my household’s utility company and calculated my monthly average electricity use in kilowatt hours (kWh). The Power Profiler used that value, along with my eGRID subregion, to produce a report of my emissions. The results were surprising!
It turns out my electricity use is about 10% higher than the national average. I had thought my household was conservative with electricity use, but it seems as though we’ve still got some work to do.
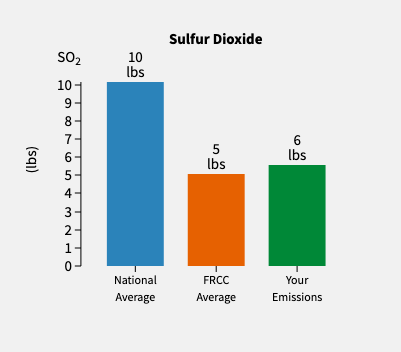
The report also calculates the actual weight of emissions your household produces each year. In my case, it’s 14,132 pounds of carbon dioxide, 6 pounds of sulfur dioxide, and 7 pounds of nitrogen oxides. Carbon dioxide is well known for its contributions to climate change, but I was less familiar with the effects of sulfur dioxide and the nitrogen oxides. Both of these compounds can negatively affect human health by harming respiratory systems and impairing breathing. Additionally, both sulfur dioxide and nitrogen oxides contribute to acid rain and reduce visibility in the atmosphere by producing haze.
While reducing emissions is not solely an individual responsibility, I look forward to the challenge of lowering my electricity use in the coming months. Stay tuned for the results in a future Action of the Month. In the meantime, you can explore ways to reduce your electricity use at home here.
To explore the EPA’s Power Profiler yourself, visit: https://www.epa.gov/energy/power-profiler#/.
About the Author
 Sadie Mills is a coordinator and environmental educator for TESI. She manages programs and events that support TESI’s mission of educating Floridians about the state’s natural systems and the threats they face.